Understanding Securities Market
How to Read a Stock Listing
Businesspeople - both owners and managers - monitor their stock prices on a daily basis. They want the value of their stock to rise for both professional and personal reasons. Stock price, for example, is a sort of "report card" on the company's progress, and it reflects the success of its managers in running the company. Many managers have a great deal of personal wealth tied directly to the fortunes of the companies for which they work.
If you have any interest in investing, you'll want to know how to interpret stock market information. Step one is learning how to read a stock listing like those printed daily in the Wall Street Journal and other newspapers as well as online at sites such as Yahoo! Finance and CNBC. Figure 13.11 "Stock Listing for Hershey Foods" reports the information on Hershey Foods for November 8, 2011. Let's use the explanations in Table 13.1 "Interpreting a Stock Quotation" to examine each item in greater detail.
Figure 13.11Stock Listing for Hershey Foods
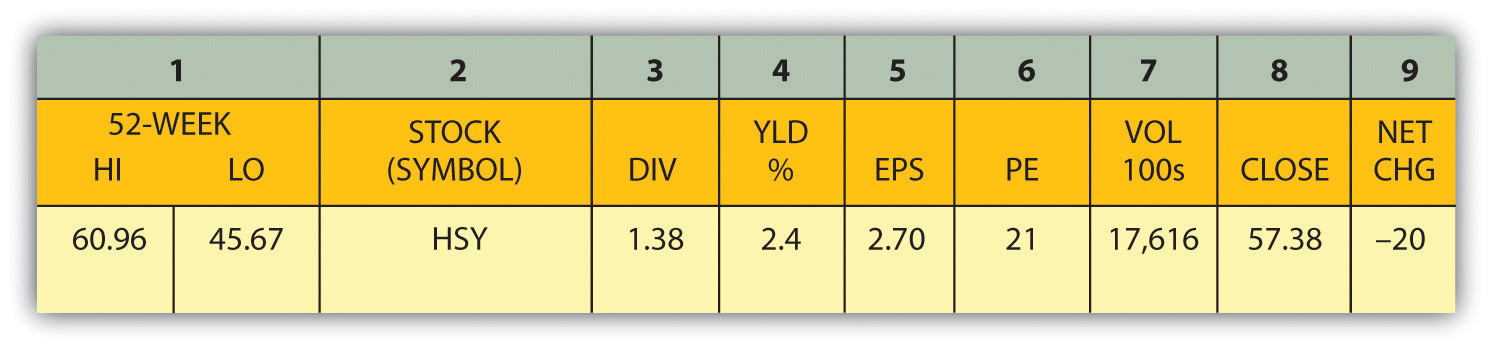
Table 13.1 Interpreting a Stock Quotation
| 52-WEEK HI | The highest price during the past year (November 8, 2010, to November 8, 2011) was $60.96. |
| 52-WEEK LO | The lowest price during the past year was $45.67. |
| STOCK (SYMBOL) | The listing is for Hershey Foods, whose stock symbol is "HSY". |
| DIV | HSY pays an annual dividend of $1.38 on each share of stock. |
| YLD % | HSY's dividend provides each investor with a 2.40 percent return (or dividend yield), as based on the day's closing stock price ($1.38 ÷ $57.38 = 2.4%). |
| EARNINGS PER SHARE | EPS is total profits divided by the number of shares of common stock outstanding. EPS for Hershey for 2008 is $ 2.70. |
| PE | The price-earnings (PE) financial ratio determines the amount that an investor would be willing to pay for every dollar of the company's earnings. This is a relative measure for comparing companies. For every $1 of HSY's earnings per share (the company's annual income divided by the number of shares of stock), investors are willing to pay $21 per share. High-growth firms usually have higher PE ratios, and vice versa. |
| VOL (100) | A common unit size for trading stocks is 100 shares, called a round lot. On November 8, 2011, 17,616 round lots were traded; in other words, the volume of HSY shares traded was 1.76 million shares (17,616 × 100). |
| CLOSE | HSY is traded on the New York Stock Exchange, which opens at 9:30 a.m. and closes at 4:00 p.m. every business day. Throughout the day, the price of HSY stock fluctuates, and at the end of the day, it stood at $57.38. |
| NET CHG | The price of $57.38 is down by $0.20 from the previous trading day's close, which was $57.58 |
What, exactly, does Hershey Foods' stock listing tell us? Here are some of the highlights: The stock has done poorly for the past twelve-month period. Its price has dropped by more than 25 percent. The closing stock price of $57.38 falls right in the middle of the annual high of $60.96 and the annual low of $45.67. The company pays an annual dividend of $1.38 per share (which gives investors a fairly good cash return on their stock of 2.40 percent). At its current PE ratio, investors are willing to pay $21 for every $1 of Hershey's earnings per share.