Histograms and Density Plots in ggplot2
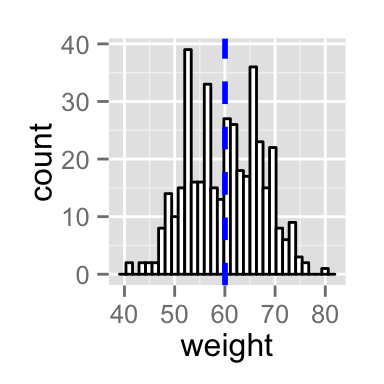
Add mean line and density plot on the histogram
- The histogram is plotted with density instead of count on y-axis
- Overlay with transparent density plot. The value of alpha controls the level of transparency
# Add mean line
p+ geom_vline(aes(xintercept=mean(weight)),
            color="blue", linetype="dashed", size=1)
# Histogram with density plot
ggplot(df, aes(x=weight)) +
 geom_histogram(aes(y=..density..), colour="black", fill="white")+
 geom_density(alpha=.2, fill="#FF6666")