Time Series Plots Using ggplot2
Plot multiple time series data
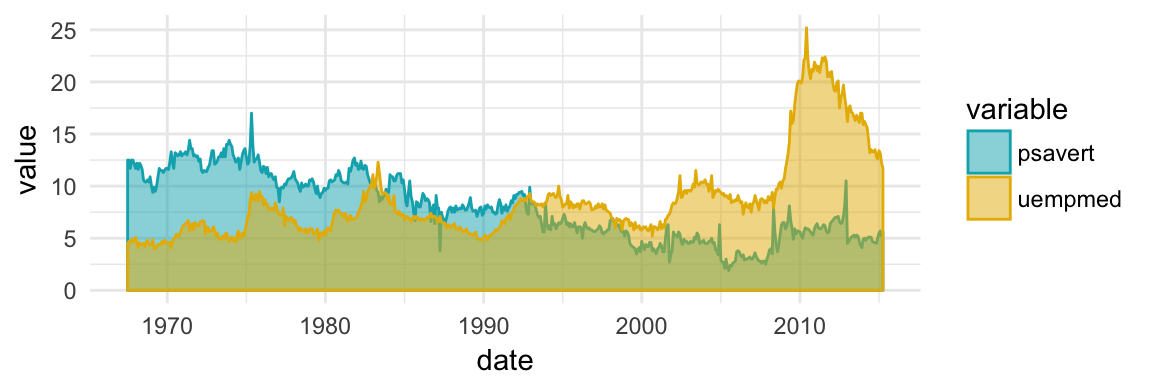
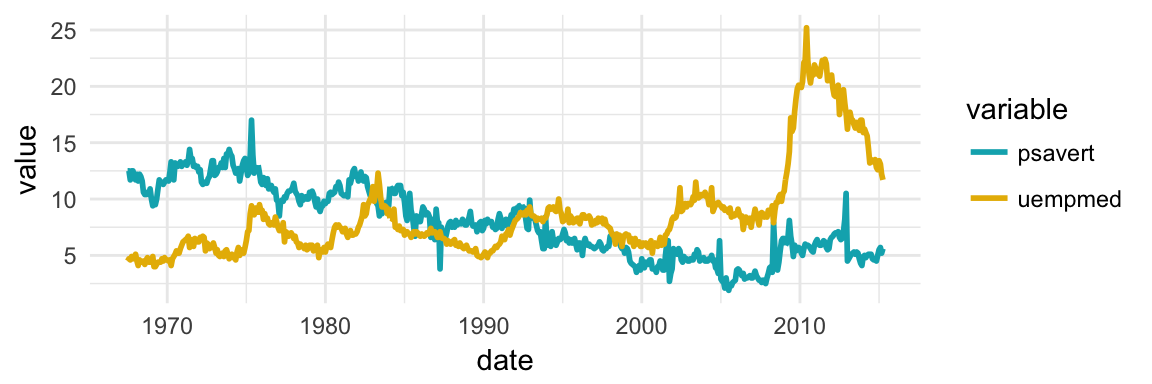
Here, we'll plot the variables psavert and uempmed by dates. You should first reshape the data using the tidyr package: - Collapse psavert and uempmed values in the same column (new column). R function: gather()[tidyr] - Create a grouping variable that with levels = psavert and uempmed
library(tidyr)
library(dplyr)
df <- economics %>%
  select(date, psavert, uempmed) %>%
  gather(key = "variable", value = "value", -date)
head(df, 3)
## # A tibble: 3 x 3 ## date variable value #### 1 1967-07-01 psavert 12.5 ## 2 1967-08-01 psavert 12.5 ## 3 1967-09-01 psavert 11.7
# Multiple line plot
ggplot(df, aes(x = date, y = value)) +
  geom_line(aes(color = variable), size = 1) +
  scale_color_manual(values = c("#00AFBB", "#E7B800")) +
  theme_minimal()
# Area plot
ggplot(df, aes(x = date, y = value)) +
  geom_area(aes(color = variable, fill = variable),
            alpha = 0.5, position = position_dodge(0.8)) +
  scale_color_manual(values = c("#00AFBB", "#E7B800")) +
  scale_fill_manual(values = c("#00AFBB", "#E7B800"))