Pearson's r
| Site: | Saylor University |
| Course: | MA121: Introduction to Statistics |
| Book: | Pearson's r |
| Printed by: | Guest user |
| Date: | Sunday, 21 June 2026, 9:28 AM |
Description
Values of the Pearson Correlation
The Pearson product-moment correlation coefficient is a measure of the strength of the linear relationship between two variables. It is referred to as Pearson's correlation or simply as the correlation coefficient. If the relationship between the variables is not linear, then the correlation coefficient does not adequately represent the strength of the relationship between the variables.
The symbol for Pearson's correlation is " " when it is measured in the population and "r" when it is measured in a sample. Because we will be dealing almost exclusively with samples, we will use
  to represent Pearson's correlation unless otherwise noted.
Pearson's can range from  to
to  . An of indicates a perfect negative linear relationship between variables, an of 0 indicates no linear relationship between variables, and an of 1 indicates a perfect positive linear relationship between variables. Figure 1 shows a scatter plot for which
  .
.
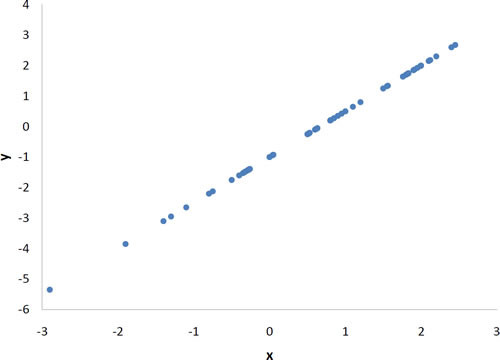
Figure 1. A perfect positive linear relationship,  .
.
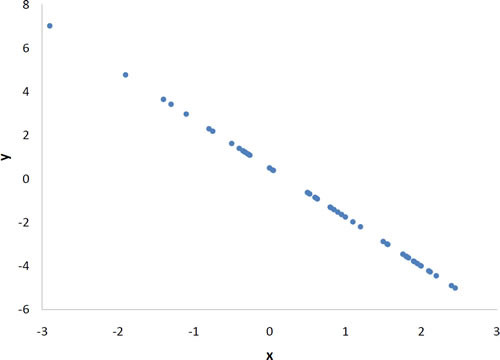
Figure 2. A perfect negative linear relationship,  .
.
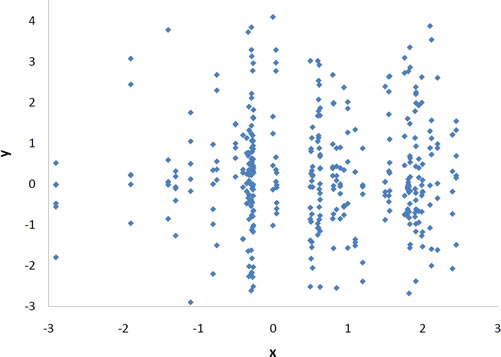
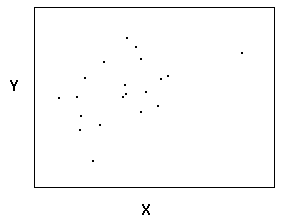
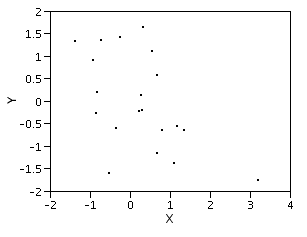
Figure 3. A scatter plot for which  . Notice that there is no relationship between
  and
and  .
.
With real data, you would not expect to get values of  of exactly
  or
or  . The data for spousal ages shown in Figure 4 and described in the introductory section has an r of 0.97.
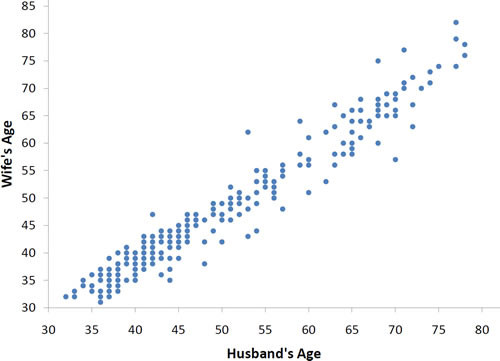
Figure 4. Scatter plot of spousal ages,  .
.
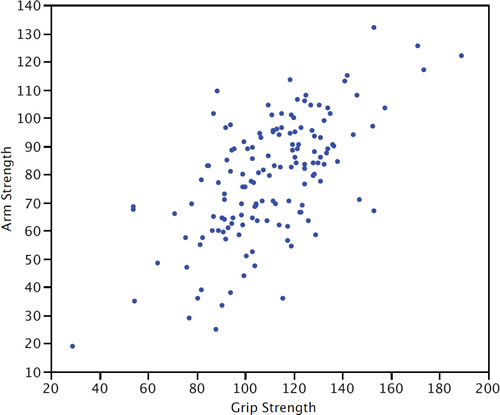
Figure 5. Scatter plot of Grip Strength and Arm Strength,  .
.
The relationship between grip strength and arm strength depicted in Figure 5 (also described in the introductory section) is  .
.
Source: David M. Lane, https://onlinestatbook.com/2/describing_bivariate_data/pearson.html![]() This work is in the Public Domain.
This work is in the Public Domain.
Questions
Question 1 out of 2.
The scatter plot below represents
- a positive association
- a negative association
- no association
Question 2 out of 2.
The scatter plot below represents
- a positive association
- a negative association
- no association
Answers
As
increases, tends to increase, so it is a positive association.As
increases, tends to decrease, so it is a negative association.
Properties of Pearson's r
A basic property of Pearson's is that its possible range is from to . A correlation of  means a perfect negative linear relationship, a correlation of 0 means no linear relationship, and a correlation of means a perfect positive linear relationship.
Pearson's correlation is symmetric in the sense that the correlation of  with
with  is the same as the correlation of with . For example, the correlation of Weight with Height is the same as the correlation of Height with Weight.
A critical property of Pearson's is that it is unaffected by linear transformations. This means that multiplying a variable by a constant and/or adding a constant does not change the correlation of that variable with other variables. For instance, the correlation of Weight and Height does not depend on whether Height is measured in inches, feet, or even miles. Similarly, adding five points to every student's test score would not change the correlation of the test score with other variables such as GPA.
Video
Questions
Question 1 out of 4.
The correlation between temperature and number of ice cream cones bought is the same whether the temperature is measured in Celsius or Fahrenheit.
- True
- False
Question 2 out of 4.
The correlation between two sets of numbers is the same as the correlation between the log of those two sets of numbers.
- True
- False
Question 3 out of 4.
Which of the following is not a possible value for Pearson's correlation?
- -1.5
- -1
- 0
- .99
Question 4 out of 4.
Which is higher, the correlation between height and weight or the correlation between weight and height?
- weight and height
- They are about the same.
- They are exactly the same.
- height and weight
Answers
It will be the same because that is a linear transformation.
It won't be the same because a log transformation is not a linear transformation.

Pearson's correlation can be any value between -1 and 1 inclusive.Correlations are symmetric so they are exactly the same.
Computing Pearson's r
There are several formulas that can be used to compute Pearson's correlation. Some formulas make more conceptual sense whereas others are easier to actually compute. We are going to begin with a formula that makes more conceptual sense.
We are going to compute the correlation between the variables and shown in Table 1. We begin by computing the mean for and subtracting this mean from all values of . The new variable is called " ". The variable "
 " is computed similarly. The variables and are said to be deviation scores because each score is a deviation from the mean. Notice that the means of and are both
  . Next we create a new column by multiplying and .
Before proceeding with the calculations, let's consider why the sum of the  column reveals the relationship between and . If there were no relationship between and , then positive values of would be just as likely to be paired with negative values of as with positive values. This would make negative values of as likely as positive values and the sum would be small. On the other hand, consider Table 1 in which high values of are associated with high values of and low values of are associated with low values of . You can see that positive values of are associated with positive values of and negative values of are associated with negative values of . In all cases, the product of and is positive, resulting in a high total for the column. Finally, if there were a negative relationship then positive values of would be associated with negative values of and negative values of would be associated with positive values of . This would lead to negative values for .
Table 1. Calculation of .
| X | Y | x | y | xy | x2 | y2 | |
|---|---|---|---|---|---|---|---|
| 1 | 4 | -3 | -5 | 15 | 9 | 25 | |
| 3 | 6 | -1 | -3 | 3 | 1 | 9 | |
| 5 | 10 | 1 | 1 | 1 | 1 | 1 | |
| 5 | 12 | 1 | 3 | 3 | 1 | 9 | |
| 6 | 13 | 2 | 4 | 8 | 4 | 16 | |
| Total | 20 | 45 | 0 | 0 | 30 | 16 | 60 |
| Mean | 4 | 9 | 0 | 0 | 6 |
Pearson's
is designed so that the correlation between height and weight is the same whether height is measured in inches or in feet. To achieve this property, Pearson's correlation is computed by dividing the sum of the column ") by the square root of the product of the sum of the
by the square root of the product of the sum of the  column
 ") and the sum of the
and the sum of the  column
 ") . The resulting formula is:
. The resulting formula is:
and therefore
(60)}}=\frac{30}{\sqrt{960}}=\frac{30}{30.984}=0.968")
An alternative computational formula that avoids the step of computing deviation scores is:
^{2}}{N}\right)} \sqrt{\left(\sum \mathrm{Y}^{2}-\frac{\left(\sum \mathrm{Y}\right)^{2}}{N}\right)}}")
Video
Questions
Question 1 out of 4.
What is the correlation between the two variables and listed below? (We suggest you use a stat program or Analysis Lab).
_________
X Y
8 10
10 9
10 11
11 11
12 8
12 10
15 14
5 8
11 11
9 9
11 12
10 13
7 12
8 7
6 9
15 12
9 10
10 11
9 11
7 5
8 7
8 10
8 6
6 9
10 9
Question 2 out of 4.
What deviation score on corresponds to the raw score of  ?
?
_________
X Y
2 4
4 3
6 5
Question 3 out of 4.
What is the sum of  ?
?
_________
X Y
2 4
4 3
6 5
Question 4 out of 4.
What is the effect on the correlation of adding  to every score on one variable?
- The correlation may go up or down, it depends on the data.
- The correlation will increase.
- The correlation will not change.
Answers
-
Compute the correlation of the two variables.

-
The mean is
 . The deviation score is
  .
. -
Small letters refer to deviation scores. Multiply the deviation score for each
 value by the corresponding deviation score for each
  value. Then add these values together.
 (0) + (0)(-1) + (2)(1) = 2}")
-
The correlation will not change. Since the scores are converted to deviation scores, adding
will have no effect.