The Mean, Standard Deviation, and Sampling Distribution of the Sample Mean
| Site: | Saylor University |
| Course: | MA121: Introduction to Statistics |
| Book: | The Mean, Standard Deviation, and Sampling Distribution of the Sample Mean |
| Printed by: | Guest user |
| Date: | Sunday, 21 June 2026, 9:26 AM |
Description
The Mean and Standard Deviation of the Sample Mean
Suppose we wish to estimate the mean  of a population. In actual practice we would typically take just one sample. Imagine however that we take sample after sample, all of the same size
  , and compute the sample mean
  of each one. We will likely get a different value of each time. The sample mean is a random variable: it varies from sample to sample in a way that cannot be predicted with certainty. We will write
  when the sample mean is thought of as a random variable, and write for the values that it takes. The random variable has a mean, denoted
  , and a standard deviation, denoted
  . Here is an example with such a small population and small sample size that we can actually write down every single sample.
Example 1
A rowing team consists of four rowers who weigh  , and
, and  pounds. Find all possible random samples with replacement of size two and compute the sample mean for each one. Use them to find the probability distribution, the mean, and the standard deviation of the sample mean .
Solution
The following table shows all possible samples with replacement of size two, along with the mean of each:

The table shows that there are seven possible values of the sample mean . The value  happens only one way (the rower weighing
  pounds must be selected both times), as does the value
  , but the other values happen more than one way, hence are more likely to be observec than and are. Since the
  samples are equally likely, we obtain the probability distribution of the sample mean just by counting:
 & \frac{1}{16} & \frac{2}{16} & \frac{3}{16} & \frac{4}{16} & \frac{3}{16} & \frac{2}{16} & \frac{1}{16}\end{array}")
Now we apply the formulas from Section 4.2.2 "The Mean and Standard Deviation of a Discrete Random Variable" in Chapter 4 "Discrete Random Variables" for the mean and standard deviation of a discrete random variable to . For we obtain.
 \\&=152\left(\frac{1}{16}\right)+154\left(\frac{2}{16}\right)+156\left(\frac{3}{16}\right)+158\left(\frac{4}{16}\right)+160\left(\frac{3}{16}\right)+162\left(\frac{2}{16}\right)+164\left(\frac{1}{16}\right) \\&=158\end{aligned}")
For  we first compute
 ") :
:
+154^{2}\left(\frac{2}{16}\right)+156^{2}\left(\frac{3}{16}\right)+158^{2}\left(\frac{4}{16}\right)+160^{2}\left(\frac{3}{16}\right)+162^{2}\left(\frac{2}{16}\right)+1")
which is  , so that
-\mu_{\bar{x}}^{2}}=\sqrt{24,974-158^{2}}=\sqrt{10}")
The mean and standard deviation of the population  in the example are
  and
and  . The mean of the sample mean that we have just computed is exactly the mean of the population. The standard deviation of the sample mean that we have just computed is the standard deviation of the population divided by the square root of the sample size:
  . These relationships are not coincidences, but are illustrations of the following formulas.
Suppose random samples of size are drawn from a population with mean and standard deviation  . The mean and standard deviation of the sample mean satisfy

The first formula says that if we could take every possible sample from the population and compute the corresponding sample mean, then those numbers would center at the number we wish to estimate, the population mean .
The second formula says that averages computed from samples vary less than individual measurements on the population do, and quantifies the relationship.
Example 2
The mean and standard deviation of the tax value of all vehicles registered in a certain state are  and
and  . Suppose random samples of size
  are drawn from the population of vehicles. What are the mean
  and standard deviation
  of the sample mean ?
Solution
Since  , the formulas yield

 This text was adapted by Saylor Academy under a Creative Commons Attribution-NonCommercial-ShareAlike 3.0 License without attribution as requested by the work's original creator or licensor.
Key Takeaways
- The sample mean is a random variable; as such it is written , and stands for individual values it takes.
- As a random variable the
sample mean has a probability distribution, a mean ,
and a standard deviation .
- There are formulas that relate the mean and standard deviation of the sample mean to the mean and standard deviation of the population from which the sample is drawn.
Exercises
1. Random samples of size  are drawn from a population with mean and standard deviation
 . Find the mean and standard deviation of the sample mean.
3. A population has mean  and standard deviation
  .
.
- Random samples of size
 are taken. Find the mean and standard deviation of the sample mean.
 -
How would the answers to part (a) change if the size of the samples were
 instead of ?
Answers
1. 
3.

- stays the same but decreases to

The Sampling Distribution of the Sample Mean
The Central Limit Theorem
In Note 6.5 "Example 1" in Section 6.1 "The Mean and Standard Deviation of the Sample Mean" we constructed the probability distribution of the sample mean for samples of size two drawn from the population of four rowers. The probability distribution is:
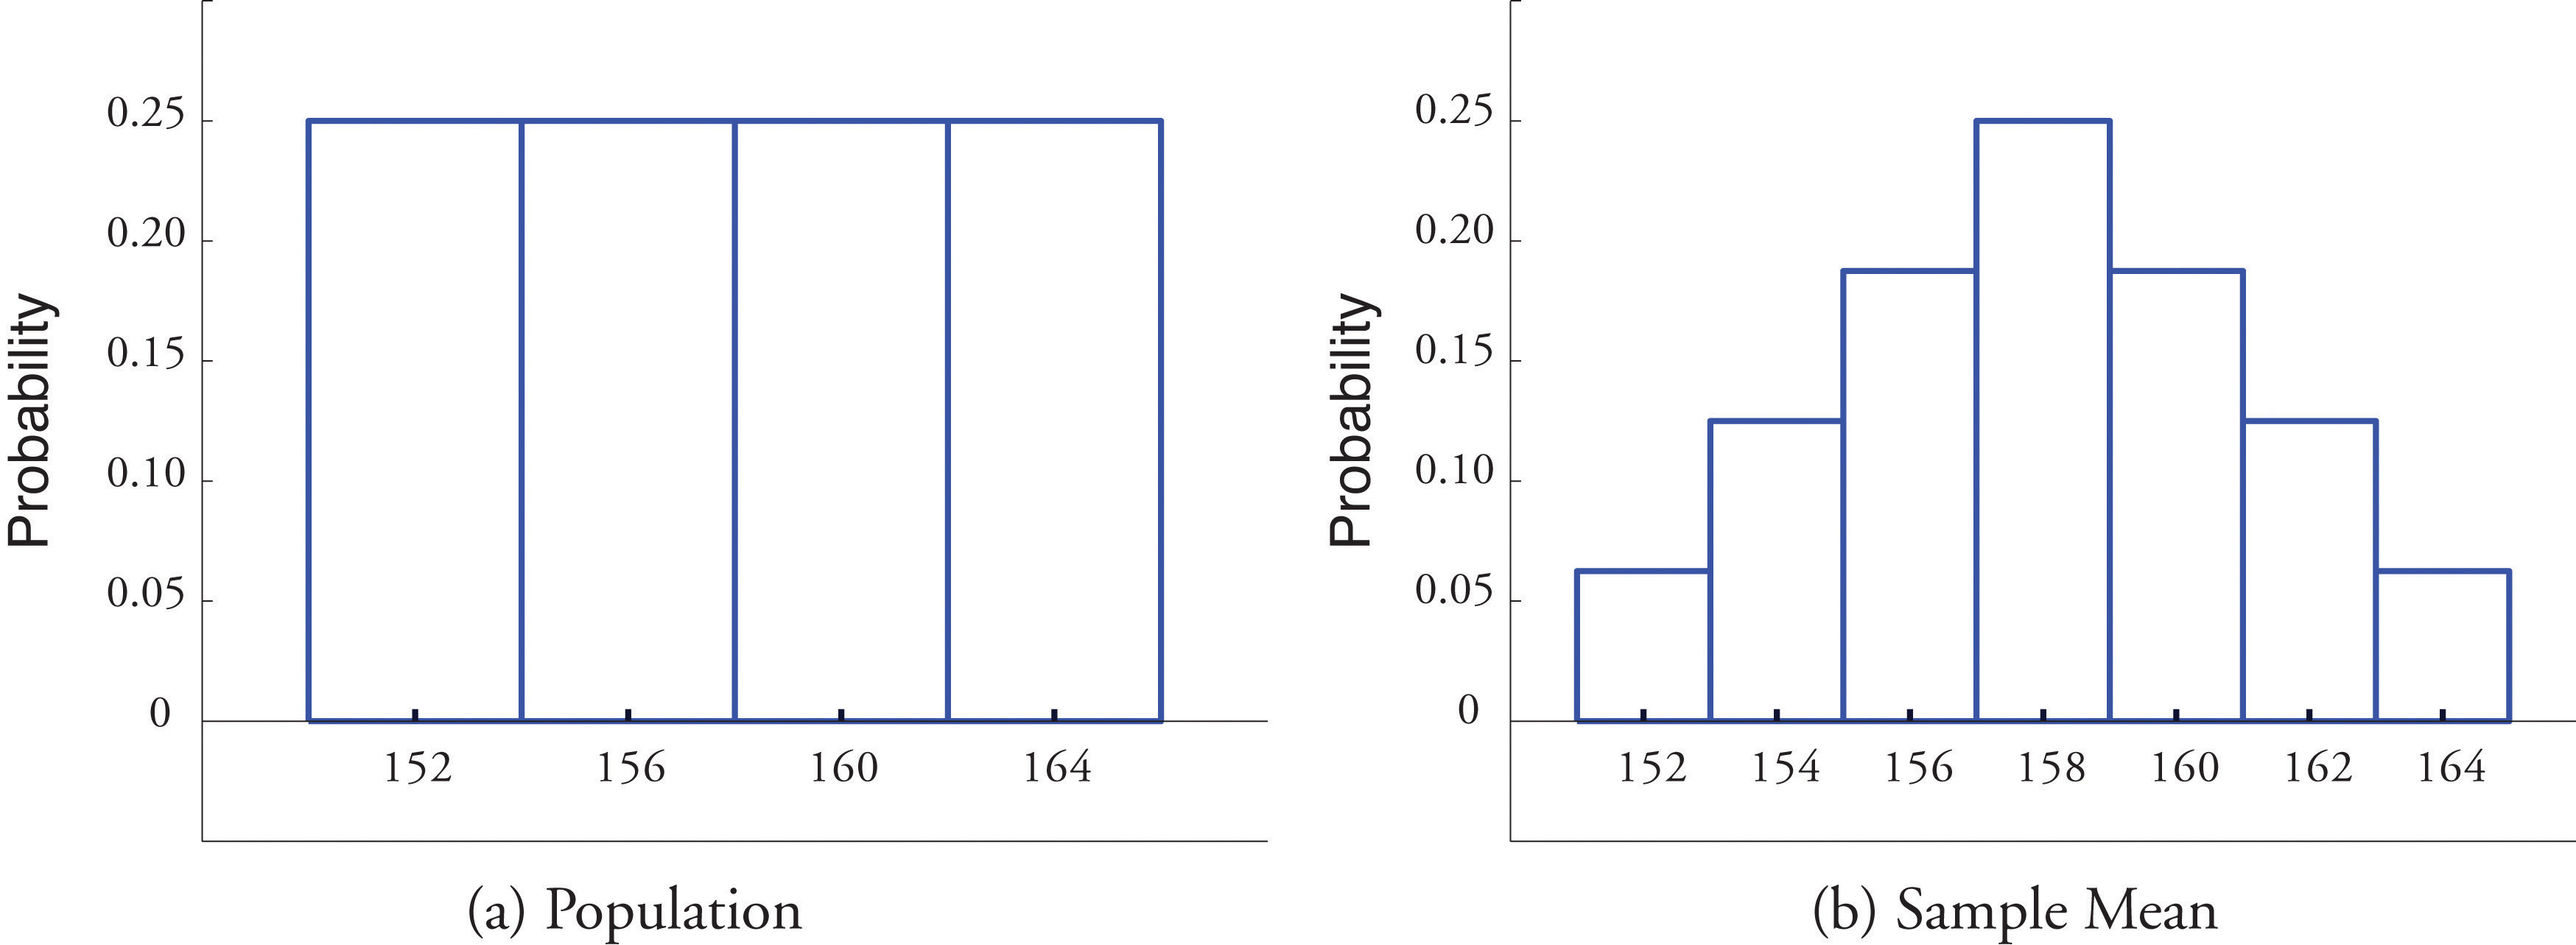
Figure 6.1 "Distribution of a Population and a Sample Mean" shows a side-by-side comparison of a histogram for the original population and a histogram for this distribution. Whereas the distribution of the population is uniform, the sampling distribution of the mean has a shape approaching the shape of the familiar bell curve. This phenomenon of the sampling distribution of the mean taking on a bell shape even though the population distribution is not bell-shaped happens in general. Here is a somewhat more realistic example.
Figure 6.1 Distribution of a Population and a Sample Mean
Suppose we take samples of size  ,
,  ,
,  , or from a population that consists entirely of the numbers
  and , half the population , half , so that the population mean is
  . The sampling distributions are:
 :
:
 & 0.5 & 0.5\end{array}")
 :
:
 & 0.03 & 0.16 & 0.31 & 0.31 & 0.16 & 0.03\end{array}")
 :
:
 & 0.00 & 0.01 & 0.04 & 0.12 & 0.21 & 0.25 & 0.21 & 0.12 & 0.04 & 0.01 & 0.00\end{array}")
 :
:
 & 0.00 & 0.00 & 0.00 & 0.00 & 0.00 & 0.01 & 0.04 & 0.07 & 0.12 & 0.16 & 0.18\end{array}\\&\begin{array}{l|llllllllll}\bar{x} & 0.55 & 0.60 & 0.65 & 0.70 & 0.75 & 0.80 & 0.85 & 0.90 & 0.95 & 1 \\\hline P(\bar{x}) & 0.16 & 0.12 & 0.07 & 0.04 & 0.01 & 0.00 & 0.00 & 0.00 & 0.00 & 0.00\end{array}\end{aligned}")
Histograms illustrating these distributions are shown in Figure 6.2 "Distributions of the Sample Mean".
Figure 6.2 Distributions of the Sample Mean
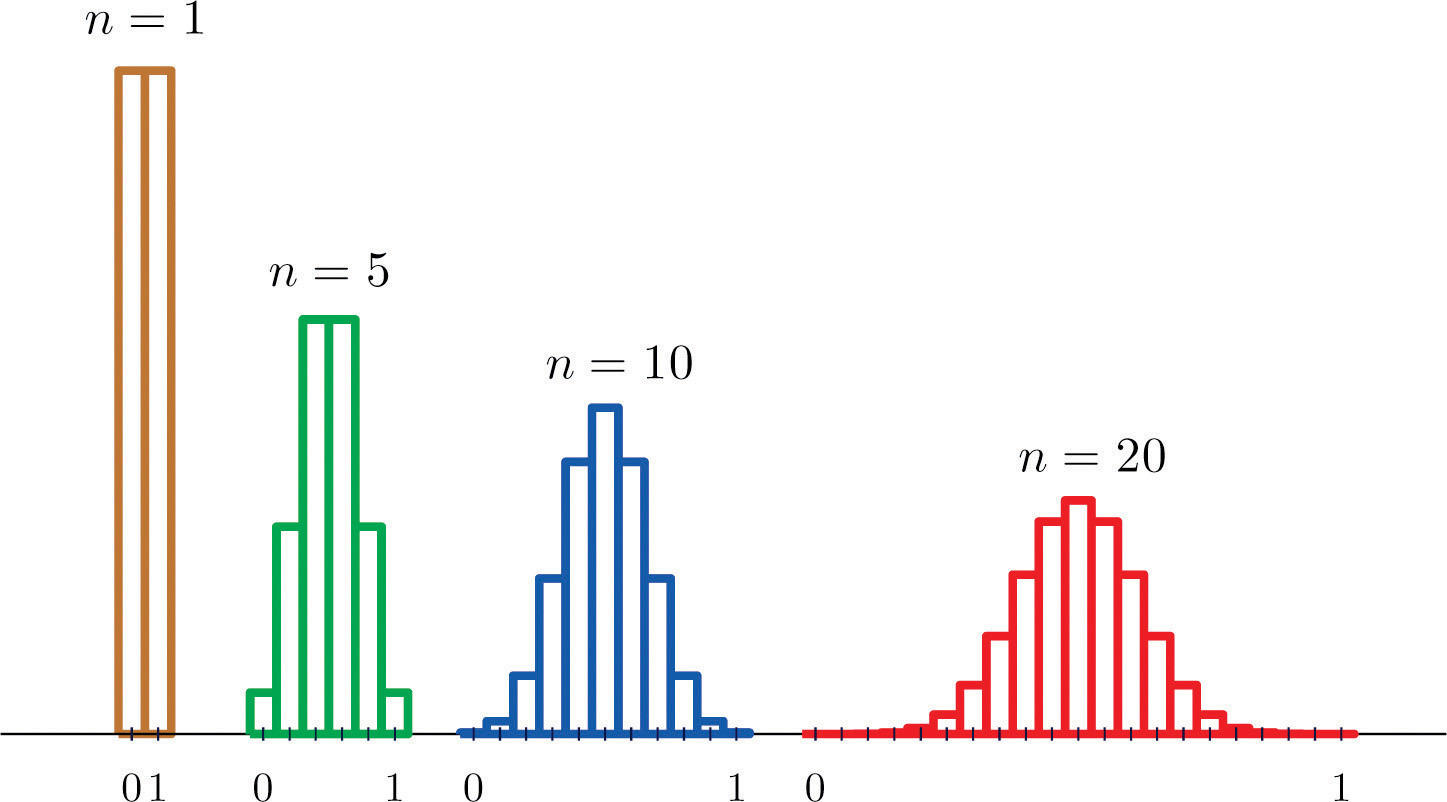
As increases the sampling distribution of evolves in an interesting way: the probabilities on the lower and the upper ends shrink and the probabilities in the middle become larger in relation to them. If we were to continue to increase then the shape of the sampling distribution would become smoother and more bell-shaped.
What we are seeing in these examples does not depend on the particular population distributions involved. In general, one may start with any distribution and the sampling distribution of the sample mean will increasingly resemble the bell-shaped normal curve as the sample size increases. This is the content of the Central Limit Theorem.
The Central Limit Theorem
For samples of size  or more, the sample mean is approximately normally distributed, with mean
  and standard deviation
  , where is the sample size. The larger the sample size, the better the approximation.
The Central Limit Theorem is illustrated for several common population distributions in Figure 6.3 "Distribution of Populations and Sample Means".
Figure 6.3 Distribution of Populations and Sample Means
![]()
The dashed vertical lines in the figures locate the population mean. Regardless of the distribution of the population, as the sample size is increased the shape of the sampling distribution of the sample mean becomes increasingly bell-shaped, centered on the population mean. Typically by the time the sample size is the distribution of the sample mean is practically the same as a normal distribution.
The importance of the Central Limit Theorem is that it allows us to make probability statements about the sample mean, specifically in relation to its value in comparison to the population mean, as we will see in the examples. But to use the result properly we must first realize that there are two separate random variables (and therefore two probability distributions) at play:
 , the measurement of a single element selected at random from the population; the distribution of is the distribution of the population, with mean the population mean and standard deviation the population standard deviation ;
- , the mean of the measurements in a sample of size ; the distribution of is its sampling distribution, with mean and standard deviation .
Example 3
Let be the mean of a random sample of size  drawn from a population with mean
  and standard deviation
  .
.
a. Find the mean and standard deviation of .
b. Find the probability that assumes a value between  and
and  .
.
c. Find the probability that assumes a value greater than  .
.
Solution:
a. By the formulas in the previous section

b. Since the sample size is at least , the Central Limit Theorem applies: is approximately normally distributed. We compute probabilities using Figure 12.2 "Cumulative Normal Probability" in the usual way, just being careful to use and not when we standardize:
 &=P\left(\frac{110-\mu_{X}}{\sigma_{X}} < Z < \frac{114-\mu_{X}}{\sigma_{X}}\right) \\ &=P\left(\frac{110-112}{5.65685} < Z < \frac{114-112}{5.65685}\right) \\ &=P(-0.35 < Z < 0.35)=0.6368-0.3632=0.2736 \end{aligned}")
c. Similarly
 &=P\left(Z > \frac{113-\mu_{X}}{\sigma_{X}}\right) \\&=P\left(Z > \frac{113-112}{5.65685}\right) \\&=P(Z > 0.18) \\&=1-P(Z < 0.18)=1-0.5714=0.4286\end{aligned}")
Note that if in Note 6.11 "Example 3" we had been asked to compute the probability that the value of a single randomly selected element of the population exceeds , that is, to compute the number ") , we would not have been able to do so, since we do not know the distribution of , but only that its mean is and its standard deviation is . By contrast we could compute
, we would not have been able to do so, since we do not know the distribution of , but only that its mean is and its standard deviation is . By contrast we could compute ") even without complete knowledge of the distribution of because the Central Limit Theorem guarantees that is approximately normal.
even without complete knowledge of the distribution of because the Central Limit Theorem guarantees that is approximately normal.
Example 4
The numerical population of grade point averages at a college has mean  and standard deviation . If a random sample of size is taken from the population, what is the probability that the sample mean will be between
  and
and  ?
?
Solution
The sample mean has mean  and standard deviation
  , so
, so
 &=P\left(\frac{2.51-\mu_{X}}{\sigma_{X}} < Z < \frac{2.71-\mu_{X}}{\sigma_{X}}\right) \\&=P\left(\frac{2.51-2.61}{0.05} < Z < \frac{2.71-2.61}{0.05}\right) \\&=P(-2 < Z < 2) \\&=P(Z < 2)-P(Z < -2) \\&=0.9772-0.0228=0.9544\end{aligned}")
Normally Distributed Populations
The Central Limit Theorem says that no matter what the distribution of the population is, as long as the sample is "large," meaning of size or more, the sample mean is approximately normally distributed. If the population is normal to begin with then the sample mean also has a normal distribution, regardless of the sample size.
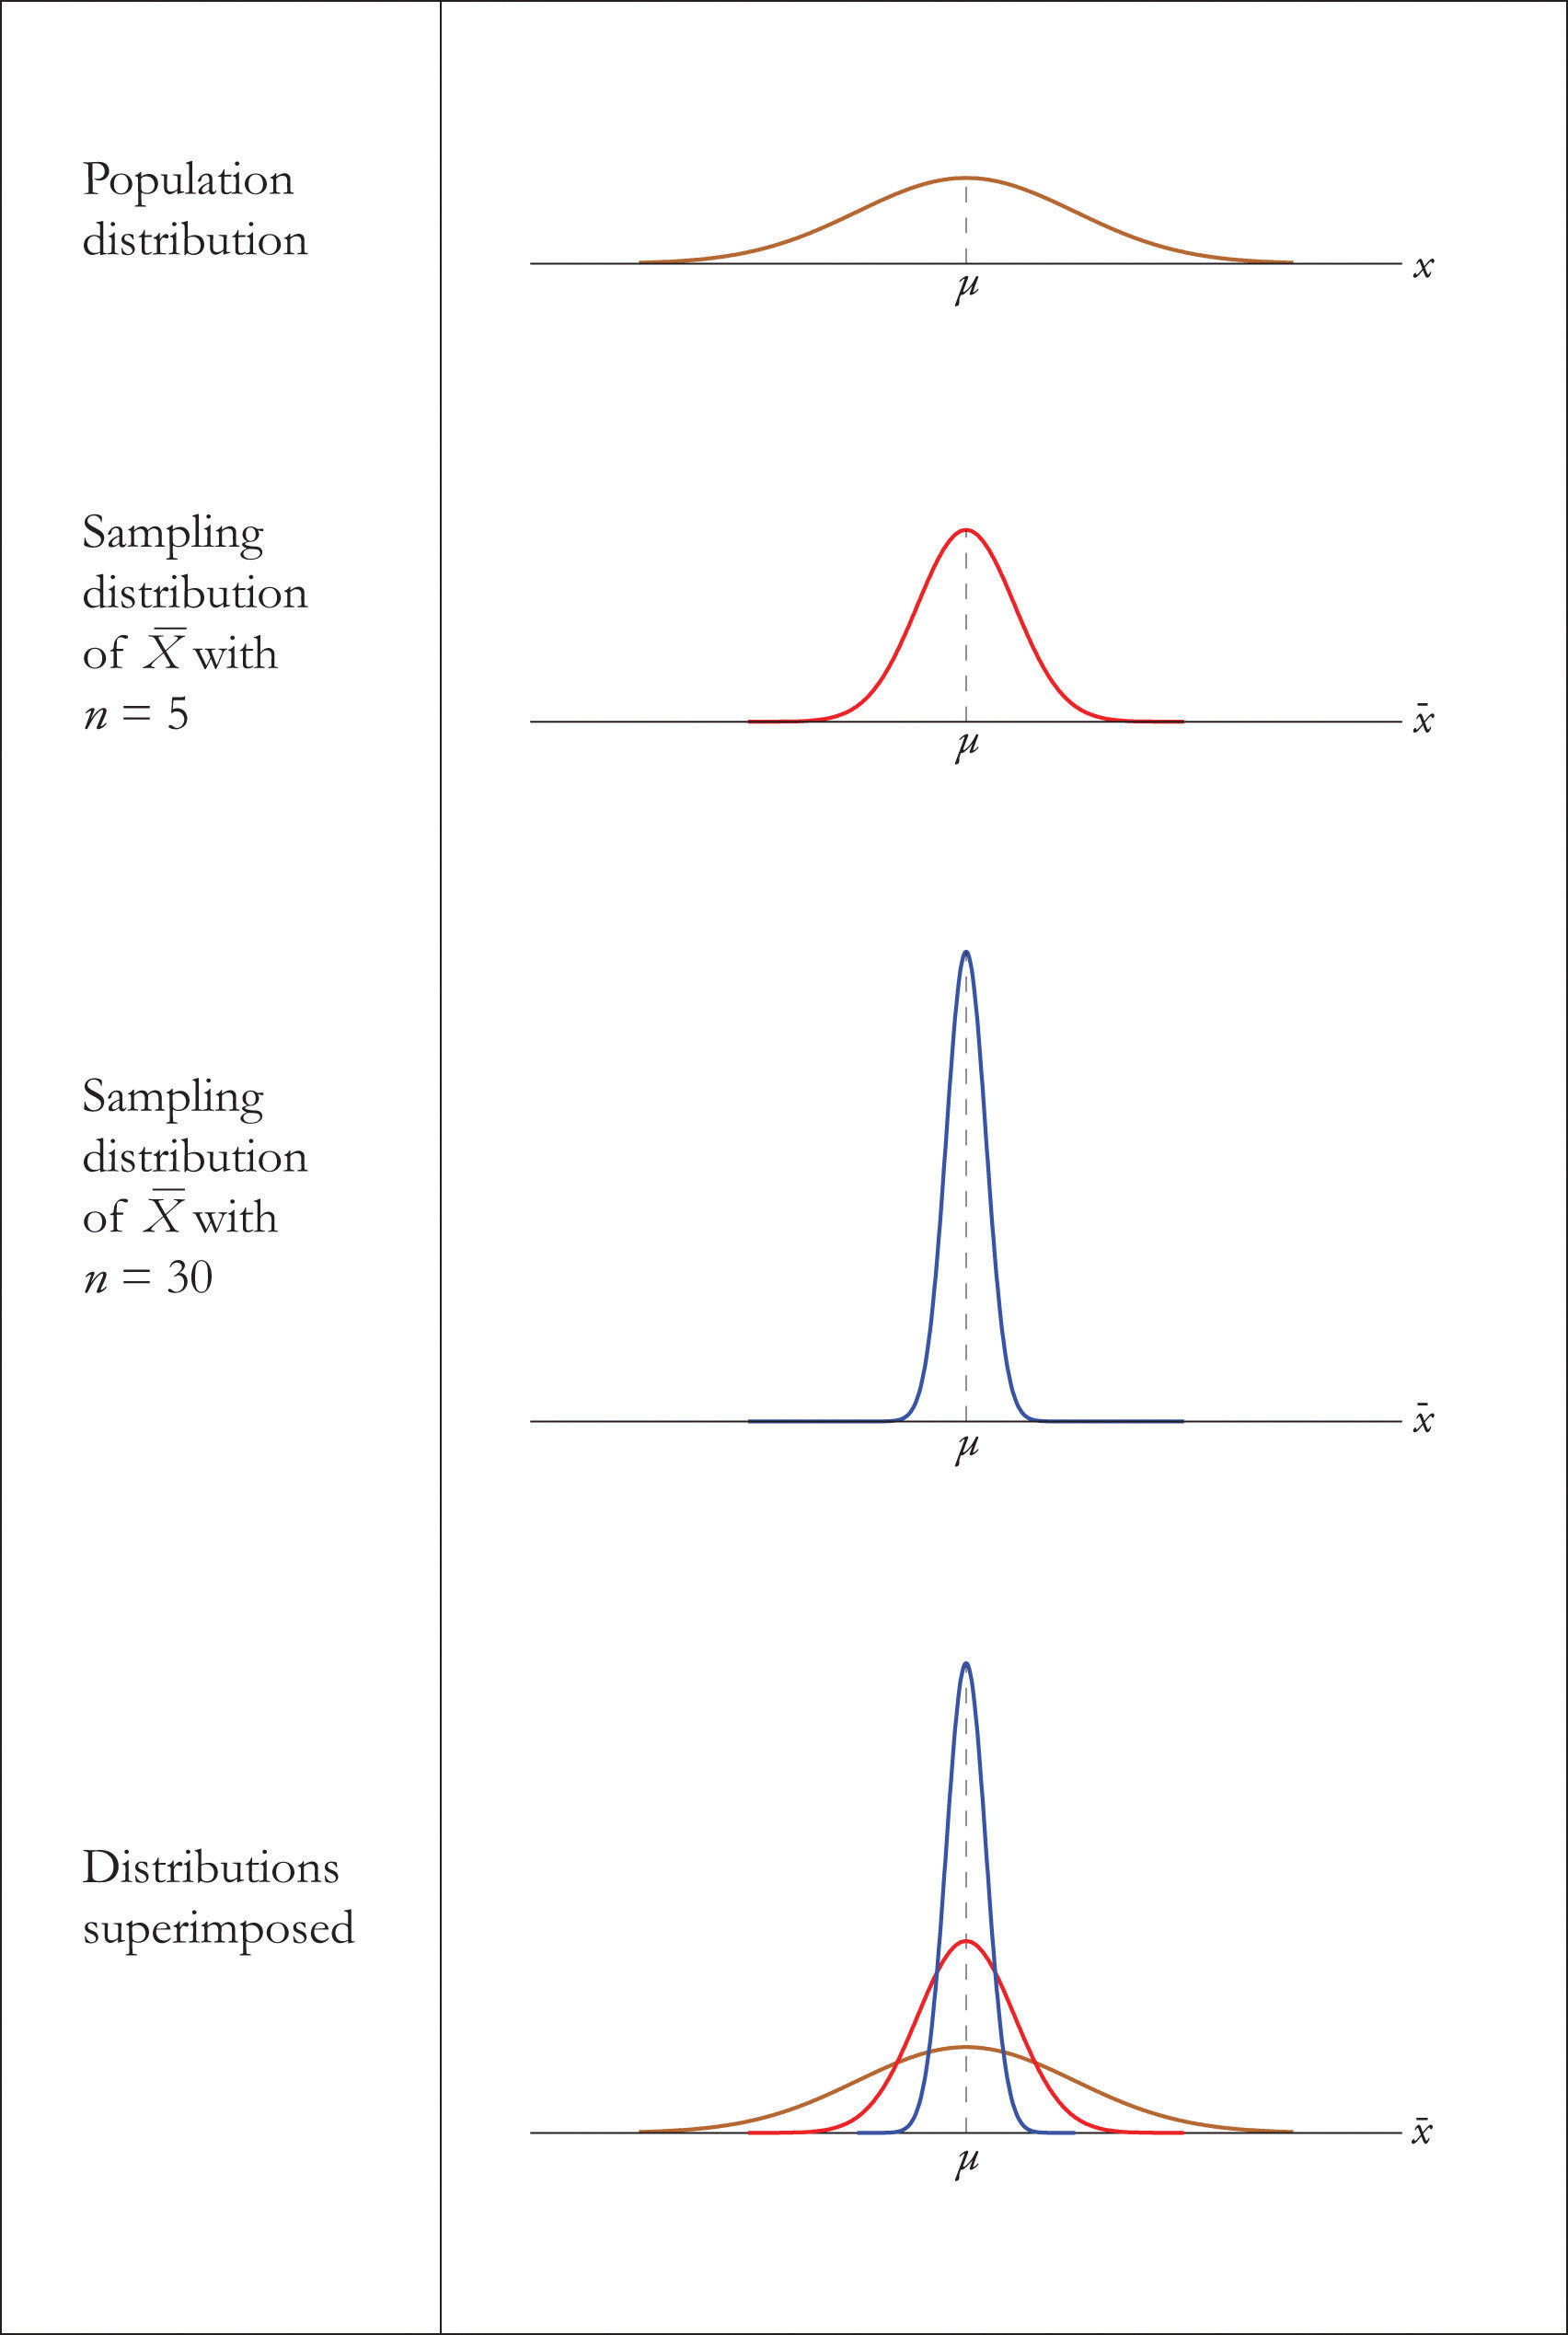
For samples of any size drawn from a normally distributed population, the sample mean is normally distributed, with mean and standard deviation , where is the sample size.
The effect of increasing the sample size is shown in Figure 6.4 "Distribution of Sample Means for a Normal Population".
Figure 6.4 Distribution of Sample Means for a Normal Population
Example 5
A prototype automotive tire has a design life of  miles with a standard deviation of
  miles. Five such tires are manufactured and tested. On the assumption that the actual population mean is miles and the actual population standard deviation is miles, find the probability that the sample mean will be less than
  miles. Assume that the distribution of lifetimes of such tires is normal.
Solution:
For simplicity we use units of thousands of miles. Then the sample mean has mean  and standard deviation
  . Since the population is normally distributed, so is , hence
 &=P\left(Z < \frac{36-\mu_{X}}{\sigma_{X}}\right) \\&=P\left(Z < \frac{36-38.5}{1.11803}\right) \\&=P(Z < -2.24)=0.0125\end{aligned}")
That is, if the tires perform as designed, there is only about a  chance that the average of a sample of this size would be so low.
Example 6
An automobile battery manufacturer claims that its midgrade battery has a mean life of months with a standard deviation of  months. Suppose the distribution of battery lives of this particular brand is approximately normal.
a. On the assumption that the manufacturer's claims are true, find the probability that a randomly selected battery of this type will last less than  months.
b. On the same assumption, find the probability that the mean of a random sample of  such batteries will be less than months.
Solution
a. Since the population is known to have a normal distribution
 &=P\left(Z < \frac{48-\mu}{\sigma}\right)=P\left(Z < \frac{48-50}{6}\right) \\ &=P(Z < -0.33)=0.3707 \end{aligned}")
b. The sample mean has mean  and standard deviation
  . Thus
 &=P\left(Z < \frac{48-\mu_{X}}{\sigma_{\bar{X}}}\right) \\&=P\left(Z < \frac{48-50}{1}\right) \\&=P(Z < -2)=0.0228\end{aligned}")
Key Takeaways
- When the sample size is at least the sample mean is normally distributed.
- When the population is normal the sample mean is normally distributed regardless of the sample size.
Exercises
1. A population has mean  and standard deviation
  .
.
for samples of size .b. Find the probability that the mean of a sample of size
will be
within units of the population mean, that is, between  and
and
 .
.3. A population has mean  and standard deviation
  .
.
a. Find the mean and standard deviation of for samples of size .
b. Find the probability that the mean of a sample of size will be less than  .
.
5. A normally distributed population has mean  and standard deviation
  .
.
a. Find the probability that a single randomly selected element of the population exceeds .
b. Find the mean and standard deviation of for samples of size  .
.
c. Find the probability that the mean of a sample of size drawn from this population exceeds .
7. A population has mean  and standard deviation
  .
.
a. Find the mean and standard deviation of for samples of size .
b. Find the probability that the mean of a sample of size will be more than  .
.
9. A normally distributed population has mean  and standard deviation
  .
.
a. Find the probability that a single randomly selected element of the population is between  and
and  .
.
b. Find the mean and standard deviation of for samples of size  .
.
c. Find the probability that the mean of a sample of size drawn from this population is between and .
11. A population has mean and standard deviation .
a. Find the mean and standard deviation of for samples of size  .
.
b.
Find the probability that the mean of a sample of size will
differ from the population mean by at least  units, that is,
is either less than
units, that is,
is either less than  or more than
  . (Hint: One way to solve
the problem is to first find the probability of the complementary
event.)
. (Hint: One way to solve
the problem is to first find the probability of the complementary
event.)
Applications
13. Suppose the mean number of days to germination of a variety of seed is, with
standard deviation  days. Find the probability that the mean
germination time of a sample of
days. Find the probability that the mean
germination time of a sample of  seeds will be within day
of the population mean.
seeds will be within day
of the population mean.15. Suppose the mean amount of
cholesterol in eggs labeled "large" is  milligrams, with standard
deviation
milligrams, with standard
deviation  milligrams. Find the probability that the mean amount
of cholesterol in a sample of
milligrams. Find the probability that the mean amount
of cholesterol in a sample of  eggs will be within
milligrams of the population mean.
eggs will be within
milligrams of the population mean.
17. Suppose speeds of vehicles on
a particular stretch of roadway are normally distributed with mean
 mph and standard deviation
  mph.
mph.
a. Find the probability that the speed of a randomly selected vehicle is between and mph.
b. Find the probability that the mean speed of randomly selected vehicles is between and mph.
19. Suppose the mean cost across
the country of a -day supply of a generic drug is  ,
with standard deviation
,
with standard deviation  . Find the probability that the mean
of a sample of prices of -day supplies of this drug will
be between
. Find the probability that the mean
of a sample of prices of -day supplies of this drug will
be between  and
and  .
.
21. Scores on a common final exam
in a large enrollment, multiple-section freshman course are normally
distributed with mean  and standard deviation
  .
.
a. Find the probability that the score on a randomly selected exam paper is between and  .
.
b. Find the probability that the mean score of  randomly selected exam papers is between and .
23. Suppose that in a certain
region of the country the mean duration of first marriages that end in
divorce is  years, standard deviation
  years. Find the
probability that in a sample of divorces, the mean age of the
marriages is at most
years. Find the
probability that in a sample of divorces, the mean age of the
marriages is at most  years.
Additional Exercises
25. A high-speed packing machine can be set to deliver between and
and
 ounces of a liquid. For any delivery setting in this range the
amount delivered is normally distributed with mean some amount
and with standard deviation
ounces of a liquid. For any delivery setting in this range the
amount delivered is normally distributed with mean some amount
and with standard deviation  ounce. To calibrate the machine it
is set to deliver a particular amount, many containers are filled, and
containers are randomly selected and the amount they contain is
measured. Find the probability that the sample mean will be within
ounce. To calibrate the machine it
is set to deliver a particular amount, many containers are filled, and
containers are randomly selected and the amount they contain is
measured. Find the probability that the sample mean will be within
 ounce of the actual mean amount being delivered to all
containers.
ounce of the actual mean amount being delivered to all
containers.Answers

b. 

b. 

b.

c. 

b. 

b.

c. 

b. 
13. 
15. 

b. 
21.
a. 
b. 
23. 
25. 