Measures of Central Location
Measures of Variability
Look at the two data sets in Table 2.1 "Two Data Sets" and the graphical representation of each, called a dot plot, in Figure 2.10 "Dot Plots of Data Sets".
Table 2.1 Two Data Sets
| Data Set I: | 40 | 38 | 42 | 40 | 39 | 39 | 43 | 40 | 39 | 40 |
| Data Set II: | 46 | 37 | 40 | 33 | 42 | 36 | 40 | 47 | 34 | 45 |
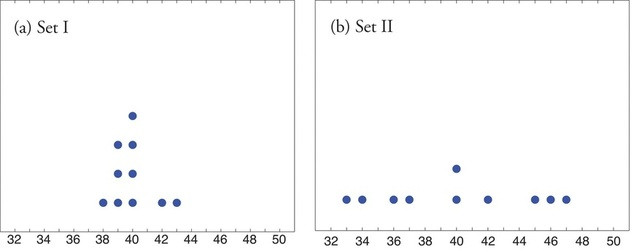
The two sets of ten measurements each center at the same value: they both have mean, median, and mode 40. Nevertheless a glance at the figure shows that they are markedly different. In Data Set I the measurements vary only slightly from the center, while for Data Set II the measurements vary greatly. Just as we have attached numbers to a data set to locate its center, we now wish to associate to each data set numbers that measure quantitatively how the data either scatter away from the center or cluster close to it. These new quantities are called measures of variability, and we will discuss three of them.