Understanding Securities Market
- 4g List and explain the tools available to the Federal Reserve during financial crises (CLO 5)
Measuring Market Performance: Market Indexes
Throughout the day, you can monitor the general drift of the stock market by watching any major news network and following the band at the bottom of your TV. News channels and broadcasts generally feature a market recap in the evening. Even music-oriented radio stations break for a minute of news every now and then, including a quick review of the stock market. Almost all these reports refer to one or more of the market indexes with which investors can track trends in stock price. Let's look more closely at some of these indicators.
The Dow
By far the most widely reported market index is the Dow Jones Industrial Average (DJIA), or "the Dow". The Dow is the total value of a "market basket" of thirty large companies headquartered in the United States. They aren't the thirty largest or best-performing companies, but rather a group selected by the senior staff members at the Wall Street Journal to represent a broad spectrum of the U.S. economy, as well as a variety of industries. The thirty selected stocks change over time, but the list usually consists of household names, such as AT&T, Coca-Cola, Disney, IBM, General Electric, and Wal-Mart.
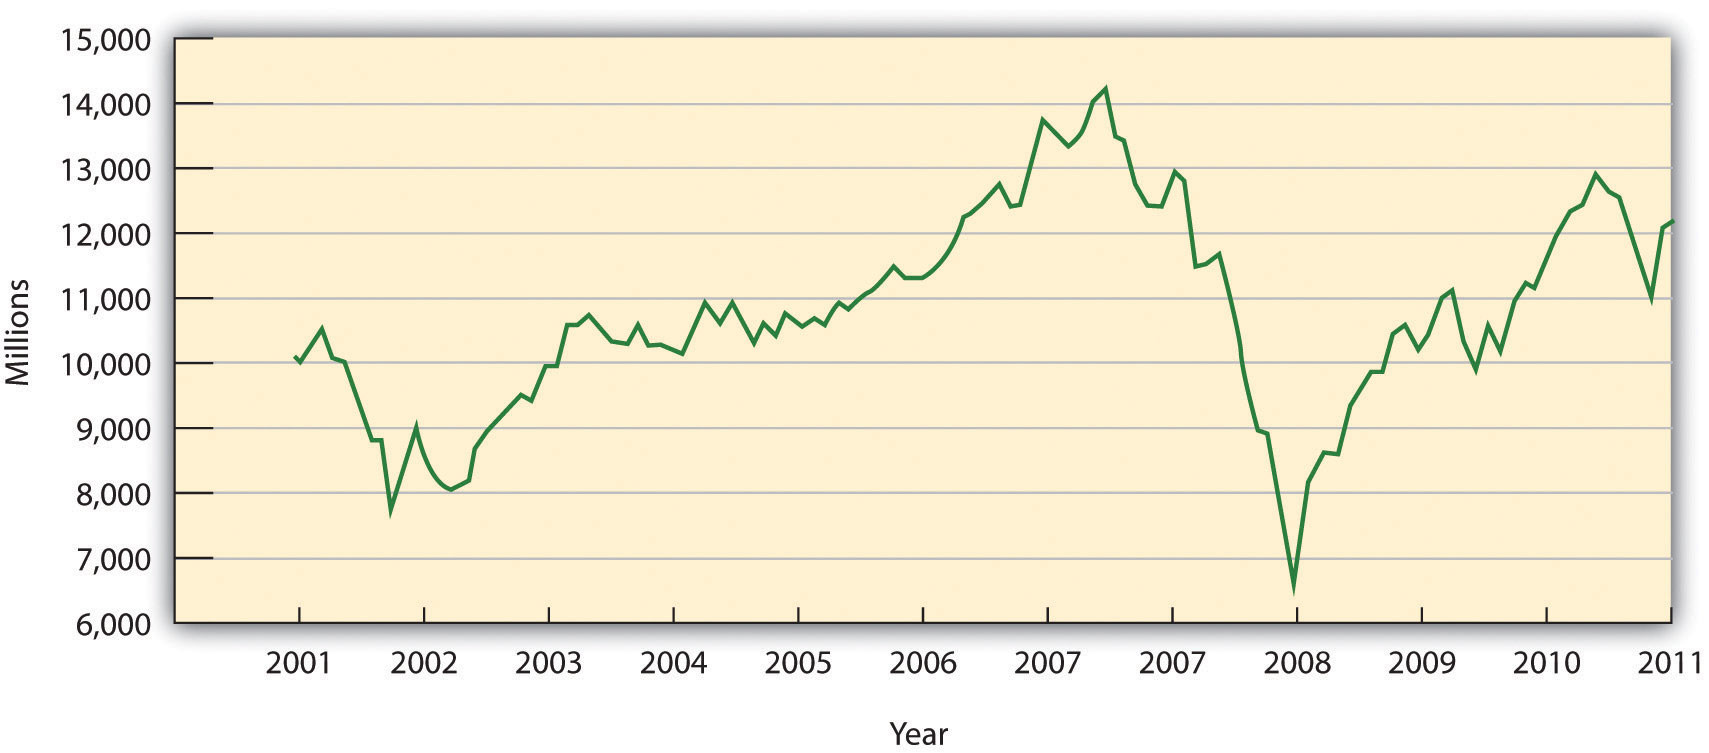
The graph in Figure 13.9 "DJIA for Ten-Year Period Ended November 2011" tracks the Dow for the ten-year period ended November 2011. The market measured by the Dow was on an upward swing from 2002 until it peaked in October 2007 at its all-time high of 14,200. At that point, it headed down until it reached a low point in March 2008 of 6,500 (a 54 percent drop from its all-time high). It has since crawled back up to 12,000, which is still 15 percent below its previous high. The path of the DOW during this ten-year period has been very volatile (subject to up and down movements in response to unstable worldwide economic and political situations)".
Figure 13.9 DJIA for Ten-Year Period Ended November 2011
The NASDAQ Composite and the S&P 500
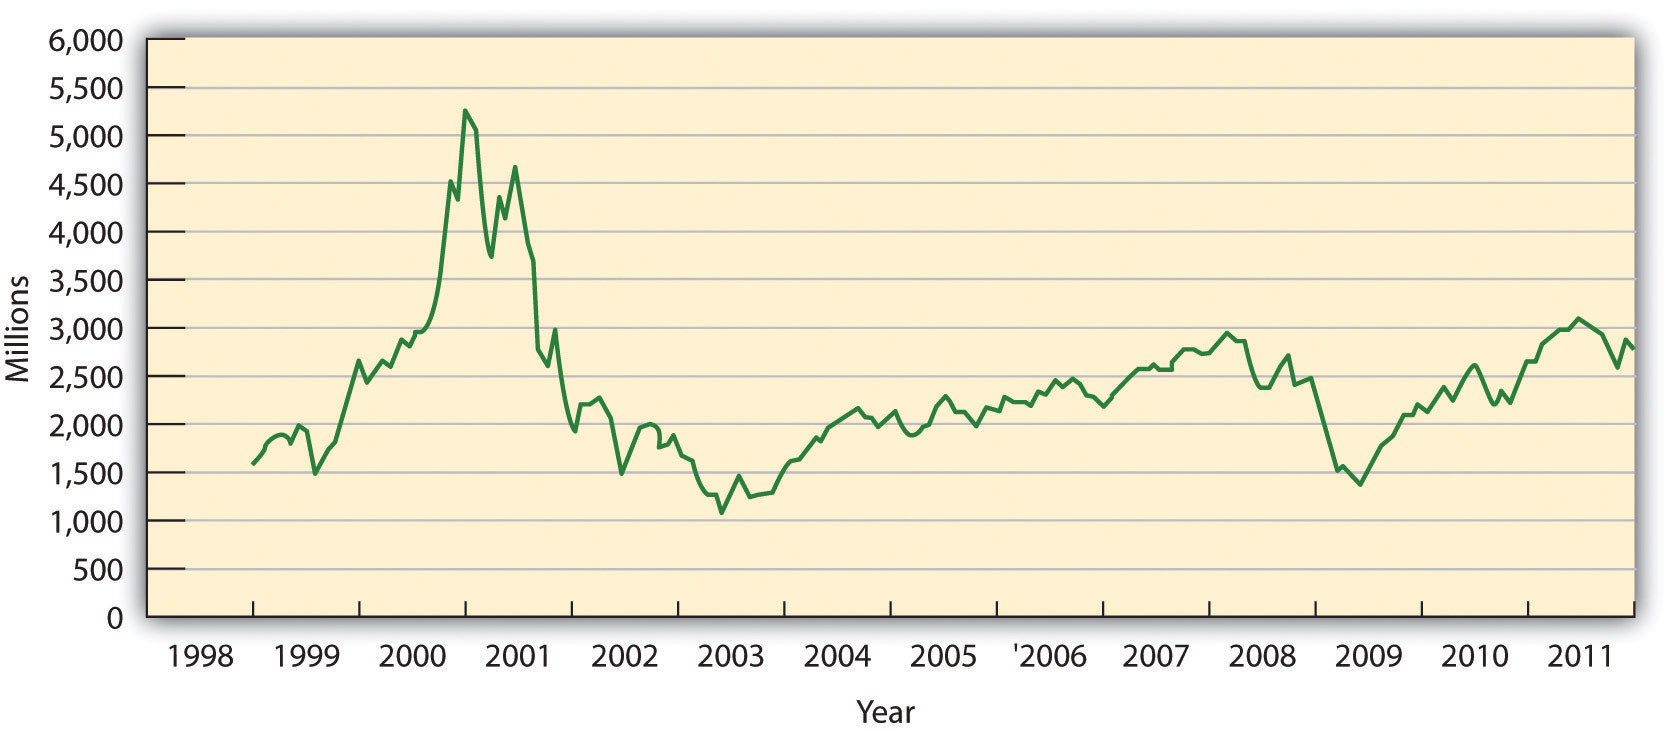
Also of interest is the performance of the NASDAQ Composite Index, which includes many technology companies. Note in Figure 13.10 "NASDAQ for Ten-Year Period Ended November 2011" that the NASDAQ peaked in early 2000 at an index of over 5,000, but as investors began reevaluating the prospects of many technologies and technology companies, prices fell precipitously and the NASDAQ shed more than 80 percent of its value. It rebounded somewhat over the next seven years, only to be shot down again when difficult economic times in 2008 spelled trouble, and it declined by 45 percent. Another broad measure of stock performance is Standard & Poor's Composite Index (S&P 500), which lists the stocks of five hundred large U.S. companies. It followed the same pattern as the Dow and the NASDAQ Composite and declined by 37 percent in 2008.
Figure 13.10 NASDAQ for Ten-Year Period Ended November 2011
When the stock market is enjoying a period of large stock-price increases, we call it a bull market; when it's declining or sluggish, we call it a bear market. The year 2008 was definitely a bear market.